 |
 |
 |
 | Random sampling: new insights into the reconstruction of coarsely-sampled wavefields |  |
![[pdf]](icons/pdf.png) |
Next: Conclusions
Up: Random sampling: new insights
Previous: Reconstruction by denoising
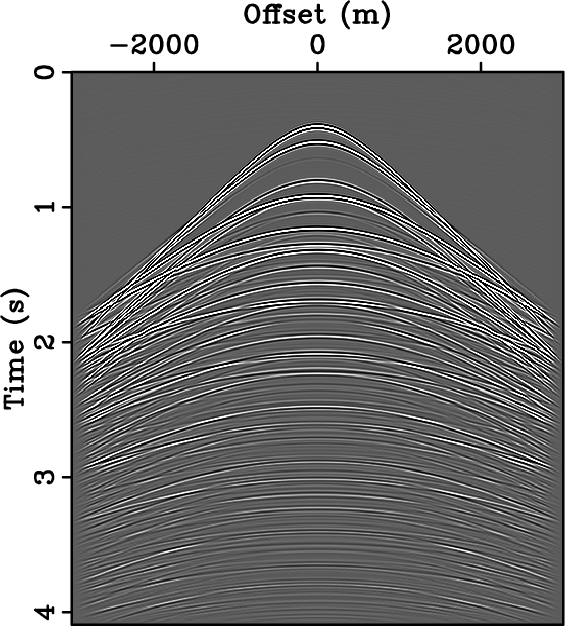
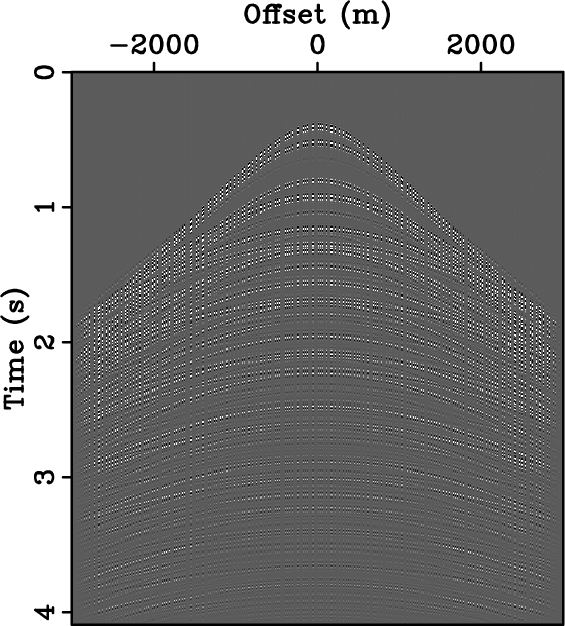
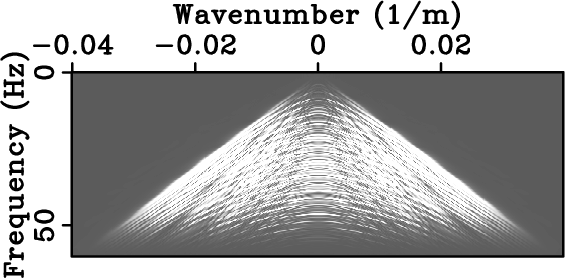
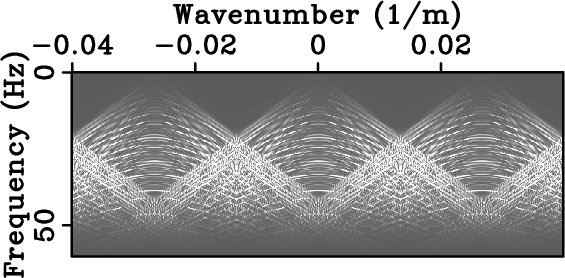
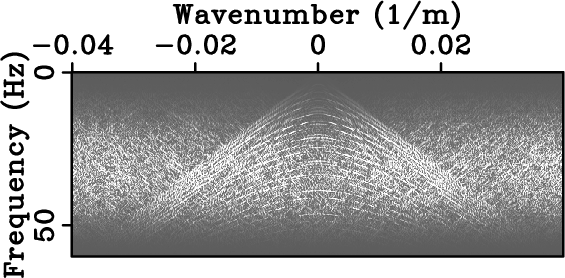
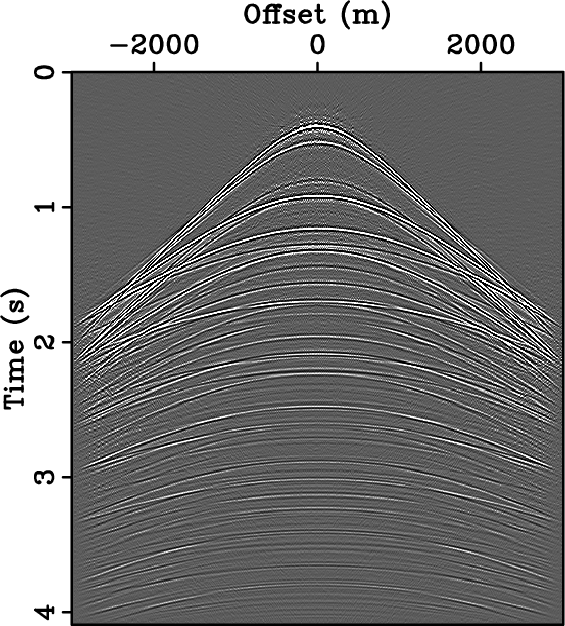
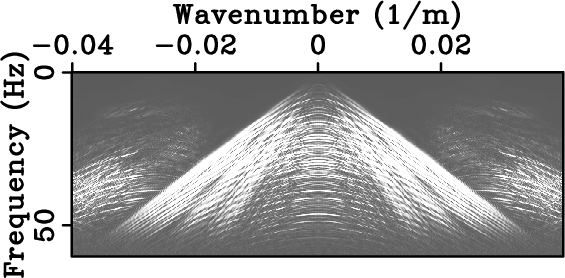
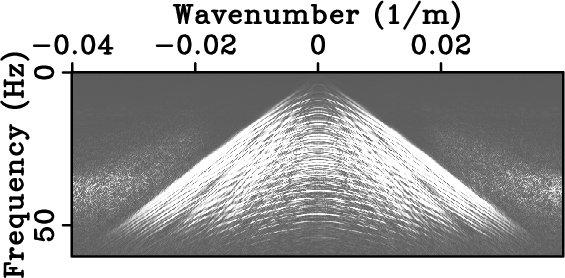
In the seismic context, the effect of coarse sampling in the  -
- domain is illustrated in
Fig. 3. Figs. 3(a)
and 3(d) show densely-sampled data and the
corresponding amplitude spectrum. Figs. 3(b) and
3(e) show regularly sub-sampled data and the
corresponding amplitude spectrum. Finally,
Figs. 3(c) and 3(f) show
randomly sub-sampled data and the corresponding amplitude
spectrum. Note how random sampling creates incoherent noise across
the spectrum.
domain is illustrated in
Fig. 3. Figs. 3(a)
and 3(d) show densely-sampled data and the
corresponding amplitude spectrum. Figs. 3(b) and
3(e) show regularly sub-sampled data and the
corresponding amplitude spectrum. Finally,
Figs. 3(c) and 3(f) show
randomly sub-sampled data and the corresponding amplitude
spectrum. Note how random sampling creates incoherent noise across
the spectrum.
Although Fourier does not provide the sparsest representation for
seismic data, there exists successful interpolation algorithms that
solve Eq. 3 with
 (see e.g. Zwartjes and Hindriks, 2001; Xu et al., 2005). We use the algorithm called
curvelet reconstruction with sparsity-promoting inversion
(Hennenfent and Herrmann, 2005; Herrmann, 2005; Hennenfent and Herrmann, 2006; Herrmann and Hennenfent, 2007)
since curvelets provide a sparser representation for seismic data than
Fourier (see e.g. Candes et al., 2006; Hennenfent and Herrmannn, 2006). In this
case,
(see e.g. Zwartjes and Hindriks, 2001; Xu et al., 2005). We use the algorithm called
curvelet reconstruction with sparsity-promoting inversion
(Hennenfent and Herrmann, 2005; Herrmann, 2005; Hennenfent and Herrmann, 2006; Herrmann and Hennenfent, 2007)
since curvelets provide a sparser representation for seismic data than
Fourier (see e.g. Candes et al., 2006; Hennenfent and Herrmannn, 2006). In this
case,
 is defined as the curvelet transform (Candes et al., 2006, and
references therein). The incoherent noise generated by
random sampling remains incoherent in the curvelet domain since
curvelets are strictly localized in the
-
domain. Fig. 4(a) and
4(b) show the interpolation results for the data of
Figs. 3(b) and 3(c),
respectively. The signal-to-reconstruction-error ratios are 6.92 dB
for regular sub-sampling and 13.78 dB for random sub-sampling. For
the same number of receivers, coarse random sampling leads to a
much better reconstruction than coarse regular sampling. When a
minimum velocity constraint is imposed during the reconstruction
process, the same conclusion holds although the difference is reduced.
is defined as the curvelet transform (Candes et al., 2006, and
references therein). The incoherent noise generated by
random sampling remains incoherent in the curvelet domain since
curvelets are strictly localized in the
-
domain. Fig. 4(a) and
4(b) show the interpolation results for the data of
Figs. 3(b) and 3(c),
respectively. The signal-to-reconstruction-error ratios are 6.92 dB
for regular sub-sampling and 13.78 dB for random sub-sampling. For
the same number of receivers, coarse random sampling leads to a
much better reconstruction than coarse regular sampling. When a
minimum velocity constraint is imposed during the reconstruction
process, the same conclusion holds although the difference is reduced.

|
|---|
data_12p5m,data_subREG,data_subIRREG,fkdata_12p5m,fkdata_subREG,fkdata_subIRREG
Figure 3. Seismic data and their corresponding spectrum. Densely-sampled data (a) and corresponding amplitude spectrum (d). Data regularly sampled below Nyquist rate (b) and corresponding amplitude spectrum (e) with strong aliasing beyond 25 Hz. Data randomly sampled at the same sub-Nyquist rate as (b) and corresponding amplitude spectrum (f) corrupted by broadband noise.
|
|---|
![[png]](icons/viewmag.png) ![[scons]](icons/configure.png)
|
|---|

|
|---|
crsi_subREG,crsi_subIRREG,fkcrsi_subREG,fkcrsi_subIRREG
Figure 4. Synthetic seismic data reconstruction using 2-D curvelet reconstruction with sparsity-promoting inversion. Interpolation result - SNR = 6.9 dB - (a) and corresponding amplitude spectrum (c) given data of Fig. 3(b). Interpolation result - SNR = 13.78 dB - (b) and corresponding amplitude spectrum given data of Fig. 3(c). For the same number of receivers, coarse random sampling leads to a much better reconstruction than coarse regular sampling.
|
|---|
|
|
|---|
|
|
|
|
| Random sampling: new insights into the reconstruction of coarsely-sampled wavefields | |
|
Next: Conclusions
Up: Random sampling: new insights
Previous: Reconstruction by denoising
2007-10-09