next up previous [pdf]

Next: Reconstruction by denoising Up: Theory Previous: Theory

Sampling below Nyquist rate

Discretizing a continuous function bandlimited to the frequency interval $ [-B,B]$ corresponds to a multiplication with a Dirac comb in the time domain and thus to a convolution with another Dirac comb in the frequency domain. As a consequence, the original spectrum becomes periodic after discretization. Problems occur when regularly sampling below Nyquist rate, i.e. $ f_s < 2B$ . Replicas of the original spectrum overlap, which creates an indetermination in the reconstruction process. This is the well-known phenomenon of aliasing. In contrast, random sampling at the same sub-Nyquist rate is less likely to create strong aliases but rather weak broadband noise. Consider for example a random sampling operator $ \mathbf{s}$ over $ \left[0,N\right]$ where $ N$ is the size of the sampling region. Suppose that $ \mathbf{s}$ samples $ n<N$ points uniformly distributed in the interval. Then, the expectation of the power spectrum of $ \mathbf{s}$ over $ \left[0,N\right]$ is given by (Dippe and Wold, 1985; Leneman, 1966)

E$\displaystyle \left[\vert\hat{\mathbf{s}}_N(u)\vert^2\right] = n^2\delta_{u0} + \left(1-\delta_{u0}\right)n,$ (1)

where the symbol $ \hat{\mbox{}}$ denotes Fourier coefficients, E$ \left[\cdot\right]$ the mathematical expectation, and $ u$ is the frequency variable. The first term in this expression is only nonzero at the origin and gives through convolution a scaled version of the original spectrum. The second term is only zero at the origin and can be assimilated to broadband noise.
Fig. 1 summarizes these observations. Fig. 1(a) shows the amplitude spectrum of a densely-sampled signal consisting of the superposition of three cosine functions. Figs. 1(b) and 1(c) show the spectra of the same signal being regularly- and randomly-sampled below Nyquist rate, respectively.

spec specREG specIRREG
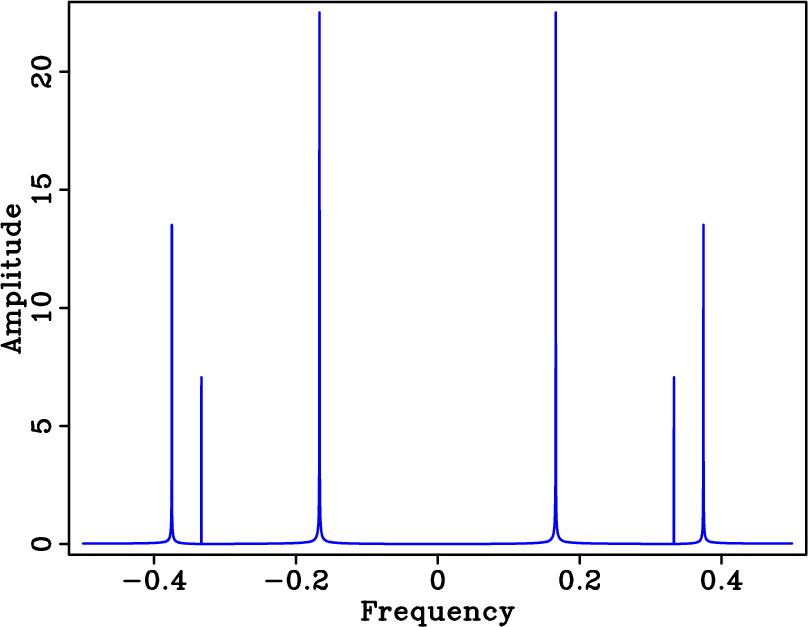
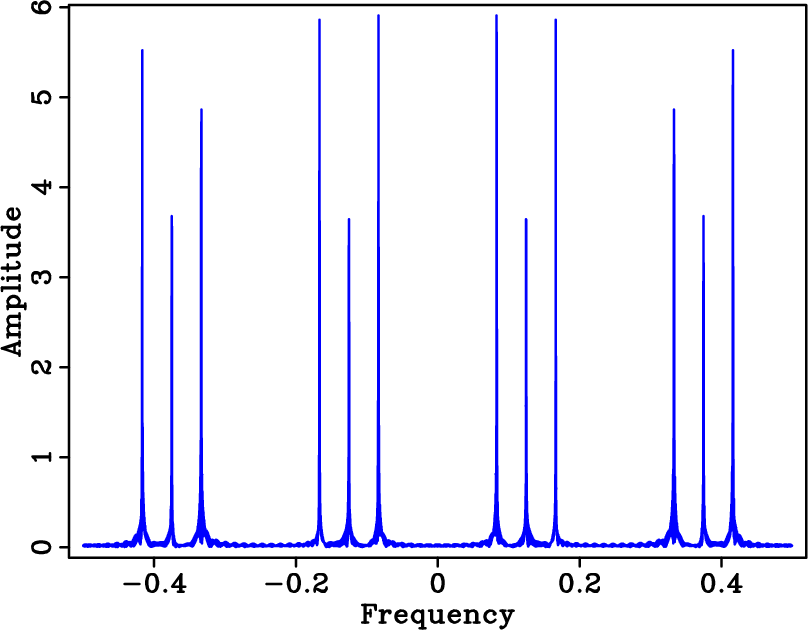
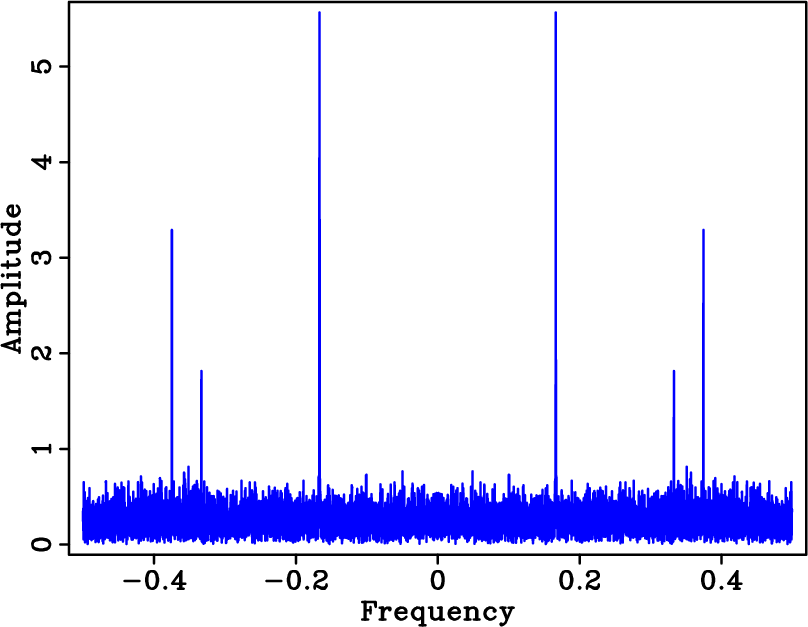
spec,specREG,specIRREG
Figure 1.
Spectra of a signal sampled above and below Nyquist rate. The signal consists of the superposition of three cosine functions. Amplitude spectrum of the densely-sampled signal (a), coarse regularly-sampled signal (b), and coarse randomly-sampled signal (c).
[pdf] [pdf] [pdf] [png] [png] [png] [scons]


next up previous [pdf]

Next: Reconstruction by denoising Up: Theory Previous: Theory

2007-10-09