Joint Recovery Method: Examples and results
Contents
Load the data and results from the output directory
label = 'MissShots_OneReceiverGather';
datadir = '../data/';
outputdir = ['../results/' label];
load([outputdir, '/SymmetricSamples.mat']);

dim = size(D1);
D1_rec = reshape(D1_rec,dim(1),dim(2));
D2_rec = reshape(D2_rec,dim(1),dim(2));

y1 = reshape(Ry1,dim(1),dim(2));
y2 = reshape(Ry2,dim(1),dim(2));
Plotting parameters
cax = 0.5;
cmap = 'gray';
fs = 18;
xval = 600;yval = 1500;zval = 200;
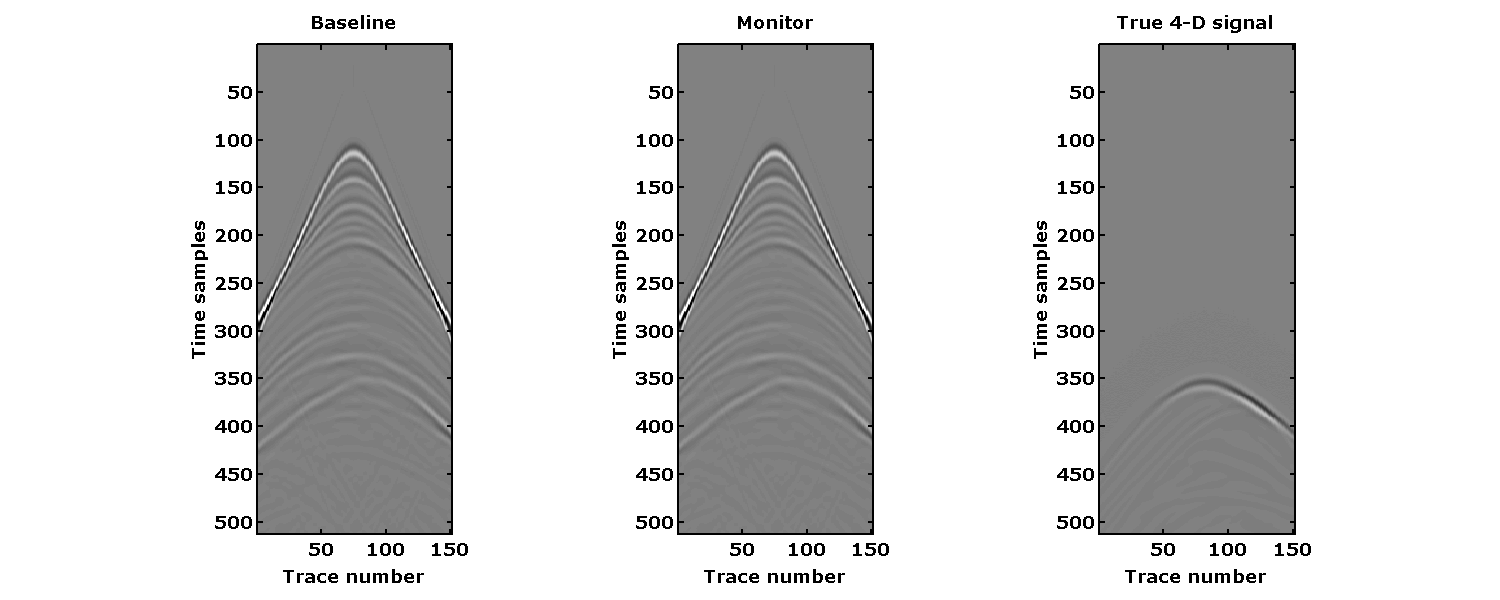
Original data
figure(1);
set(gcf,'Position',[100 100 yval xval]);
subplot(131);imagesc(D1);
colormap(cmap); caxis([-cax cax]);
xlabel('Trace number','FontSize',fs, 'FontName','verdana','FontWeight','bold');
ylabel('Time samples','FontSize',fs, 'FontName','verdana','FontWeight','bold');
title('Baseline','FontSize',fs, 'FontName','verdana','FontWeight','bold');
pbaspect([xval yval zval]);
set(gca,'fontsize',fs,'FontName','verdana','FontWeight','bold','LineWidth',2);
subplot(132);imagesc(D2);
colormap(cmap); caxis([-cax cax]);
xlabel('Trace number','FontSize',fs, 'FontName','verdana','FontWeight','bold');
ylabel('Time samples','FontSize',fs, 'FontName','verdana','FontWeight','bold');
title('Monitor','FontSize',fs, 'FontName','verdana','FontWeight','bold');
pbaspect([xval yval zval]);
set(gca,'fontsize',fs,'FontName','verdana','FontWeight','bold','LineWidth',2);
subplot(133);imagesc(D1-D2);
colormap(cmap); caxis(0.1*[-cax cax]);
xlabel('Trace number','FontSize',fs, 'FontName','verdana','FontWeight','bold');
ylabel('Time samples','FontSize',fs, 'FontName','verdana','FontWeight','bold');
title('True 4-D signal','FontSize',fs, 'FontName','verdana','FontWeight','bold');
pbaspect([xval yval zval]);
set(gca,'fontsize',fs,'FontName','verdana','FontWeight','bold','LineWidth',2);
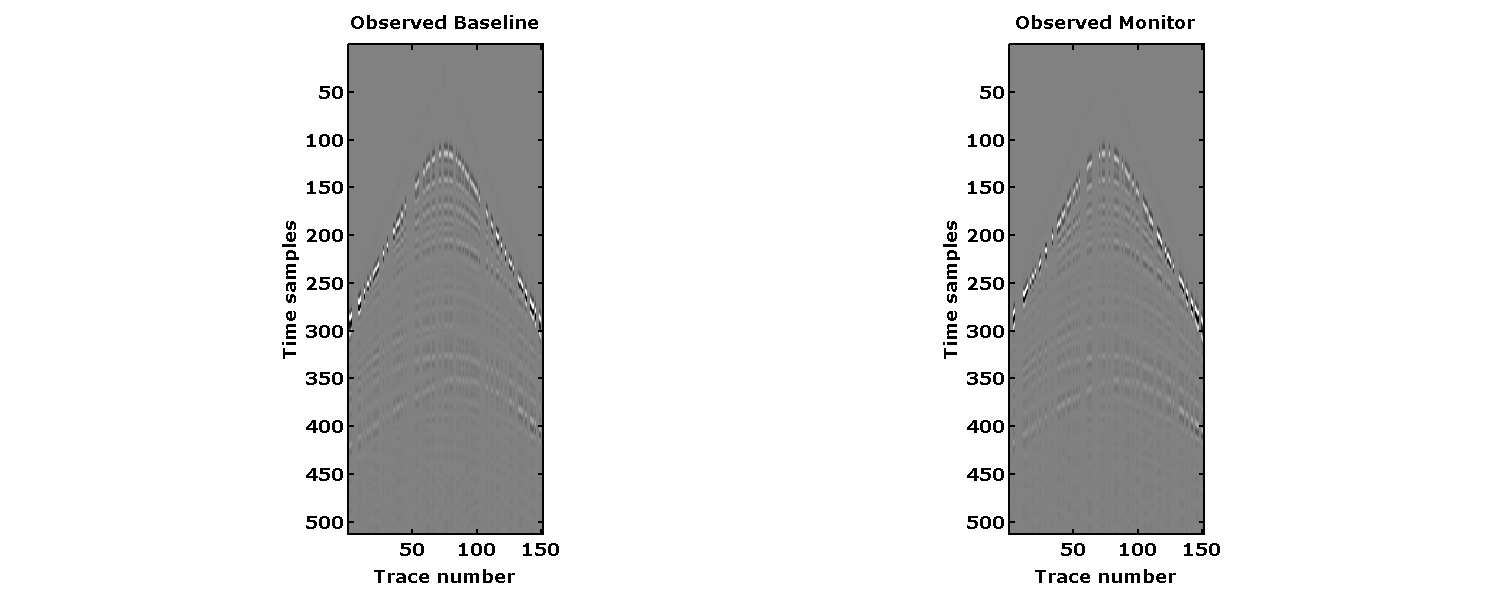
Measured data with randomly missing shots in both vintages
figure(2);
set(gcf,'Position',[100 100 yval xval]);
subplot(121);imagesc(y1); colormap(cmap); caxis([-cax cax]);
title('Observed Baseline','FontSize',fs, 'FontName','verdana','FontWeight','bold');
xlabel('Trace number','FontSize',fs, 'FontName','verdana','FontWeight','bold');
ylabel('Time samples','FontSize',fs, 'FontName','verdana','FontWeight','bold');
pbaspect([xval yval 100]);
set(gca,'fontsize',fs,'FontName','verdana','FontWeight','bold','LineWidth',2);
subplot(122);imagesc(y2); colormap(cmap); caxis([-cax cax]);
title('Observed Monitor','FontSize',fs, 'FontName','verdana','FontWeight','bold');
xlabel('Trace number','FontSize',fs, 'FontName','verdana','FontWeight','bold');
ylabel('Time samples','FontSize',fs, 'FontName','verdana','FontWeight','bold');
pbaspect([xval yval 100]);
set(gca,'fontsize',fs,'FontName','verdana','FontWeight','bold','LineWidth',2);
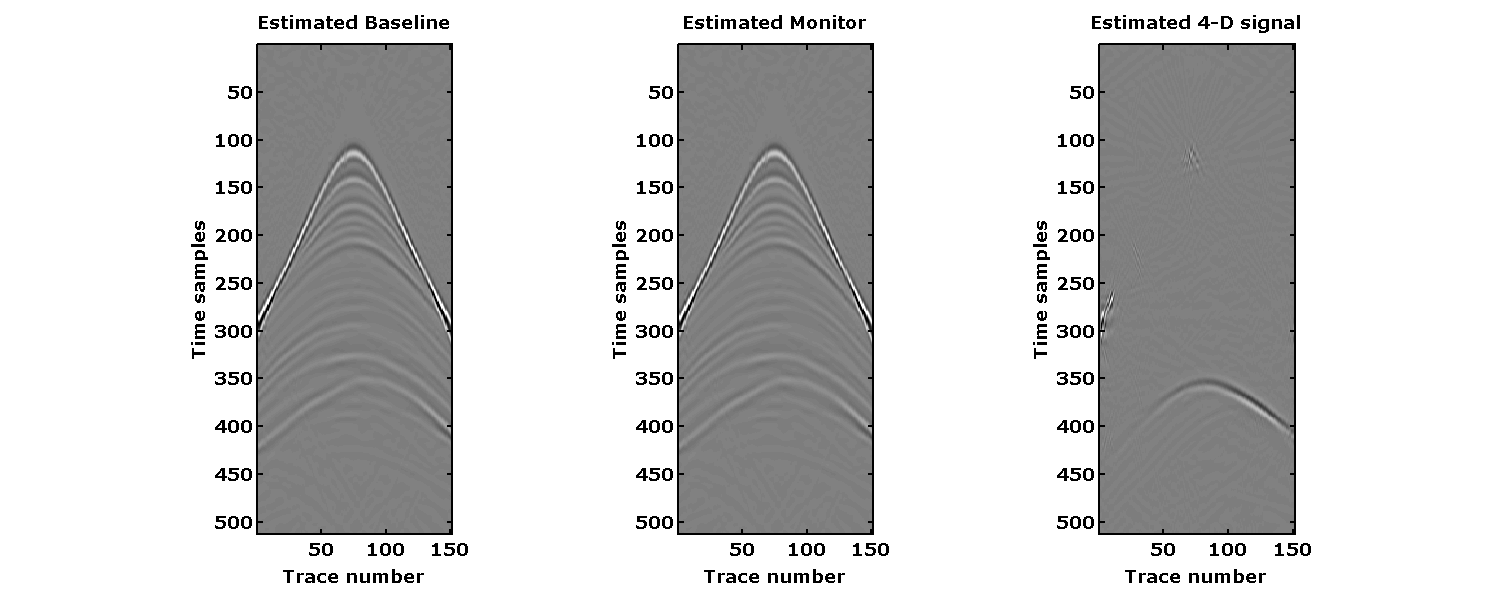
Estimated data after joint recovery method
figure(3);
set(gcf,'Position',[100 100 yval xval]);
subplot(131);imagesc(D1_rec);
colormap(cmap); caxis([-cax cax]);
xlabel('Trace number','FontSize',fs, 'FontName','verdana','FontWeight','bold');
ylabel('Time samples','FontSize',fs, 'FontName','verdana','FontWeight','bold');
title('Estimated Baseline','FontSize',fs, 'FontName','verdana','FontWeight','bold');
pbaspect([xval yval zval]);
set(gca,'fontsize',fs,'FontName','verdana','FontWeight','bold','LineWidth',2);
subplot(132);imagesc(D2_rec);
colormap(cmap); caxis([-cax cax]);
xlabel('Trace number','FontSize',fs, 'FontName','verdana','FontWeight','bold');
ylabel('Time samples','FontSize',fs, 'FontName','verdana','FontWeight','bold');
title('Estimated Monitor','FontSize',fs, 'FontName','verdana','FontWeight','bold');
pbaspect([xval yval zval]);
set(gca,'fontsize',fs,'FontName','verdana','FontWeight','bold','LineWidth',2);
subplot(133);imagesc(D1_rec-D2_rec);
colormap(cmap); caxis(0.1*[-cax cax]);
xlabel('Trace number','FontSize',fs, 'FontName','verdana','FontWeight','bold');
ylabel('Time samples','FontSize',fs, 'FontName','verdana','FontWeight','bold');
title('Estimated 4-D signal','FontSize',fs, 'FontName','verdana','FontWeight','bold');
pbaspect([xval yval zval]);
set(gca,'fontsize',fs,'FontName','verdana','FontWeight','bold','LineWidth',2);
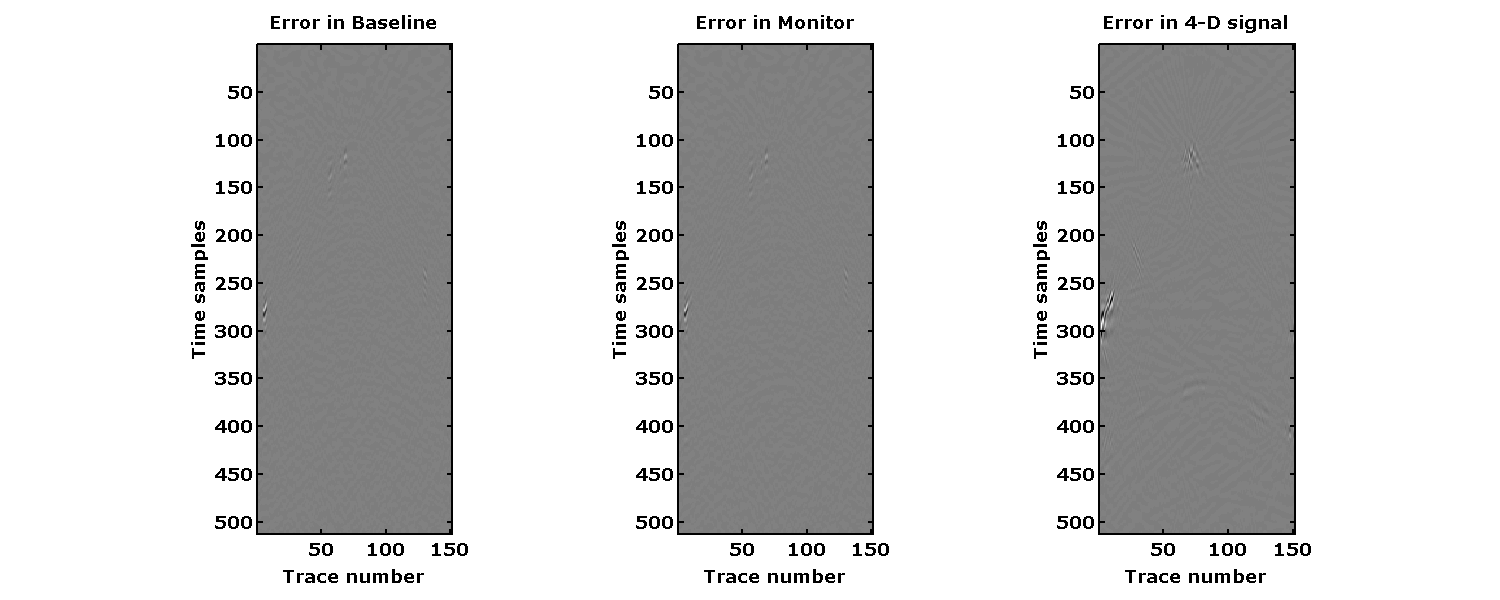
Residual : Original - Estimate
figure(4);
set(gcf,'Position',[100 100 yval xval]);
subplot(131);imagesc(D1-D1_rec);
colormap(cmap); caxis([-cax cax]);
xlabel('Trace number','FontSize',fs, 'FontName','verdana','FontWeight','bold');
ylabel('Time samples','FontSize',fs, 'FontName','verdana','FontWeight','bold');
title('Error in Baseline','FontSize',fs, 'FontName','verdana','FontWeight','bold');
pbaspect([xval yval zval]);
set(gca,'fontsize',fs,'FontName','verdana','FontWeight','bold','LineWidth',2);
subplot(132);imagesc(D2-D2_rec);
colormap(cmap); caxis([-cax cax]);
xlabel('Trace number','FontSize',fs, 'FontName','verdana','FontWeight','bold');
ylabel('Time samples','FontSize',fs, 'FontName','verdana','FontWeight','bold');
title('Error in Monitor','FontSize',fs, 'FontName','verdana','FontWeight','bold');
pbaspect([xval yval zval]);
set(gca,'fontsize',fs,'FontName','verdana','FontWeight','bold','LineWidth',2);
subplot(133);imagesc((D1-D2)-(D1_rec-D2_rec));
colormap(cmap); caxis(0.1*[-cax cax]);
xlabel('Trace number','FontSize',fs, 'FontName','verdana','FontWeight','bold');
ylabel('Time samples','FontSize',fs, 'FontName','verdana','FontWeight','bold');
title('Error in 4-D signal','FontSize',fs, 'FontName','verdana','FontWeight','bold');
pbaspect([xval yval zval]);
set(gca,'fontsize',fs,'FontName','verdana','FontWeight','bold','LineWidth',2);